This article will go through the steps required to make a new Report in Salesforce. The steps can be followed in order, or you can skip ahead to the specific steps or actions that you need help with. Screenshots with annotation have been provided to give you visual cues along with the written instructions.
Table of Contents
Creating a Salesforce Report
THINGS YOU WILL NEED
You do not need to be a system administrator in order to create a report, but you do need to have the “Create and Customize Reports’ permission added to our user profile.
1. Open the Reports App
Open the Reports App by selecting Reports from the navigation bar (If visible). If you don’t see it in the navigation bar, then open the App Launcher (nine dots on the left-hand side), search for Reports, and choose the App link there.
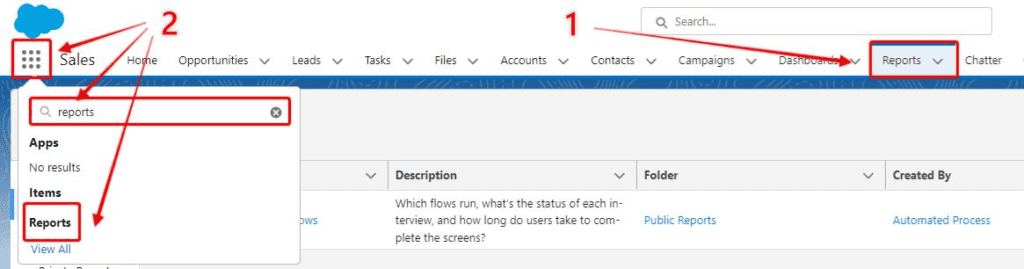
Note: If you cannot find the Reports app in either of these ways, then you probably do not have the required permission sets applied to your profile.
2. Open the Report Builder
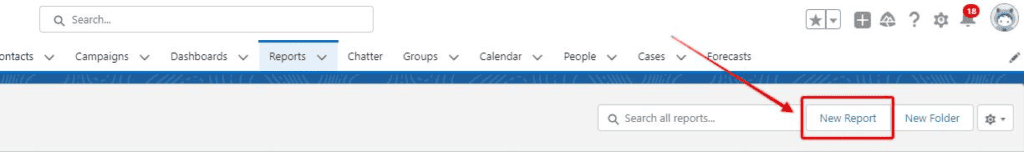
The Reports App will display the lists of reports and the ones you have access to can be viewed from there. To create a new report, open the Report Builder by choosing New Report.
RELATED RESOURCE: Getting Data Driven Insights Using Salesforce Reports
3. Choose A Report Type
Report Types are preset templates that determine what data will be available for you to display in your report.
By default, a large range of report types will be available based on default Salesforce objects (Accounts, Opportunities, Contacts etc).
If you want to make reports based on a custom object, or multiple custom objects, then you will need to first create a new Salesforce report type (in Settings), before open the Report Builder.
Before building your report you will need to spend some time planning your report. You specifically need to know what fields you want to display and which Salesforce objects those fields are from.
If you are not a system administrator then you will need to ensure you have access to the objects you plan to include in a report, because you won’t be able to make reports on objects you don’t typically have access to.
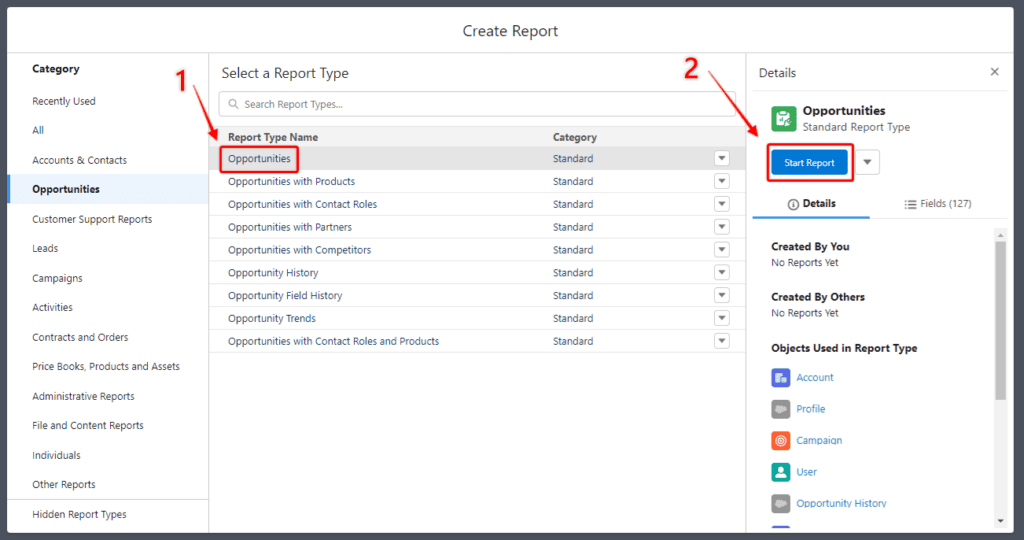
You can run reports based on a single object (e.g. Opportunities), or multiple objects (e.g. Opportunities with Accounts and Contacts). For the purpose of this guide, I’m going to keep it simple and create a single Object report, based on the Opportunities object.
Choose the desired report type, then select Start Report.
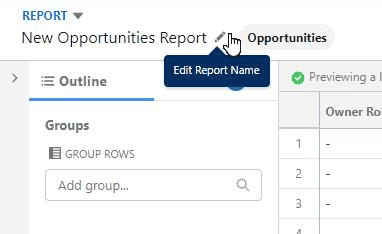
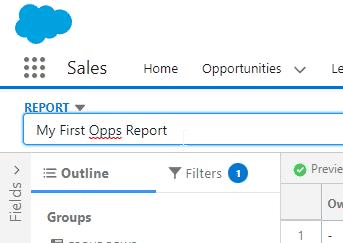
4. Give The Report a Name
Choose the edit icon next to the default report name, and provide a descriptive report name that will help you remember the purpose of the report.
Now your report has a name, the two main things you need to configure in a report are to do with what data is displayed (which fields, what order etc.) and which records you want to include in the report (filtering).
The selection of relevant fields/columns and the arranging of those fields is done in the Outline section of the report builder, and the Filters section is where I can adjust which records get included.
5. Choose The Required Report Fields & Their Order
In this sample report, my aim is to see a list of all opportunities (current and historic), organized by the Account holder of each opportunity, and also organized by the stage each opportunity is at.
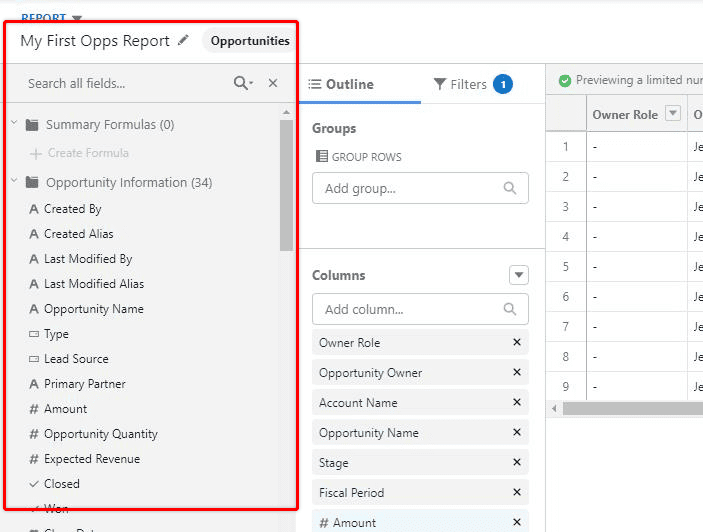
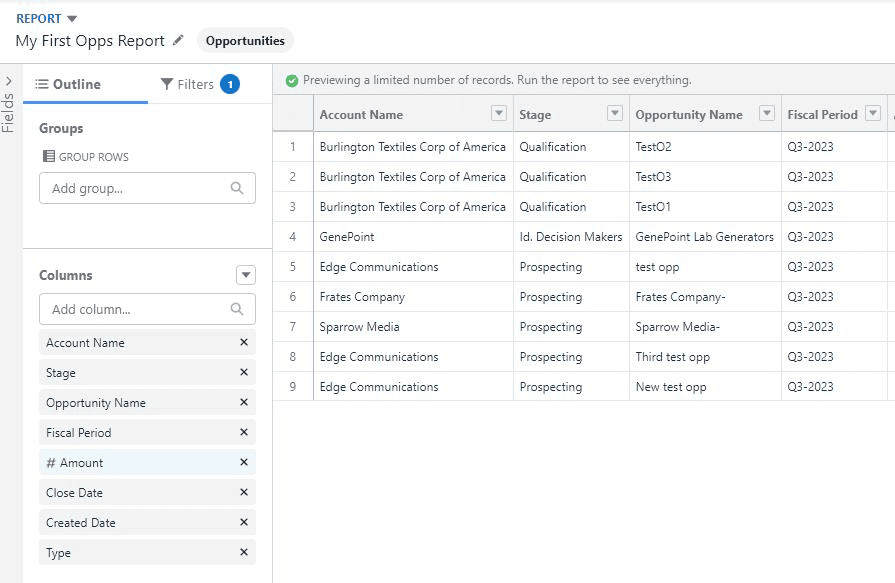
Each object field that you want to add, will be one of the report columns. The columns that you select can be dragged higher or lower in the list to change the order that the columns that appear in on the report.
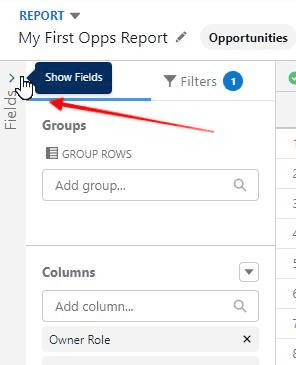
You can search for them in the Add Columns search area, or reveal all available fields you could include by revealing the hidden sidebar.
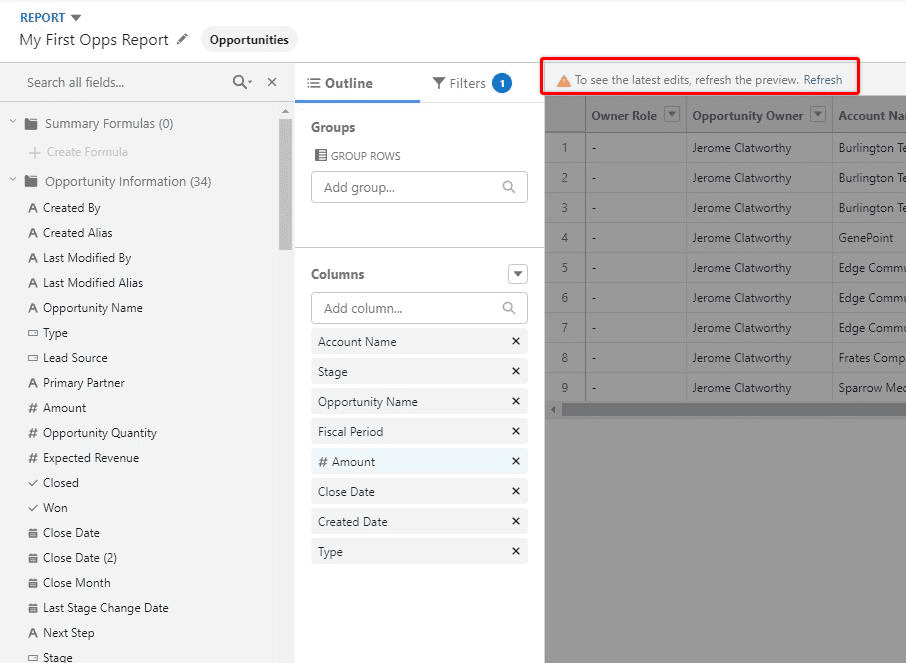
After you have selected your report fields, and got them arranged in the order you want, choose Refresh to get an updated view of what your report is starting to look like.
Keep in mind, that the number of records shown in the report builder may be less than you are expecting, and that is ok.
Often times it will show just a sample of your data. It is not until you choose Save & Run that you will see the entire list of eligible records appear.
My report is starting to provide the information I want, but I would like it easier to see which opportunities are associated with each Account, sorted by Opportunity Stage.
This can be done using the Groups option, above the columns we have been working with. You can group your report by up to three different fields, and arrange them in the order you would like the groupings to take place.
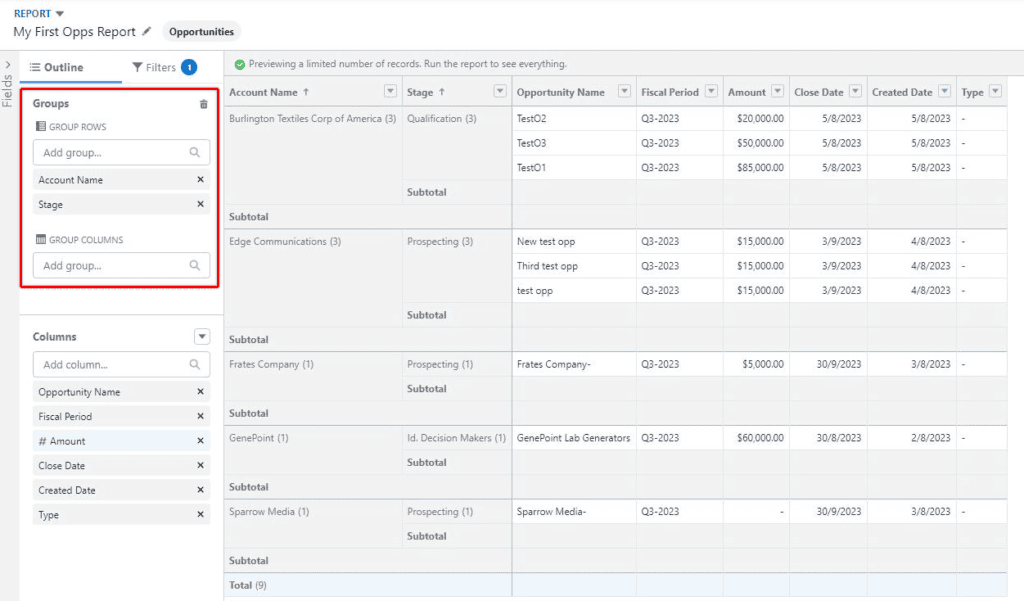
The report is starting to look how I hoped, so I will not need to add or re-arrange columns or groups any further.
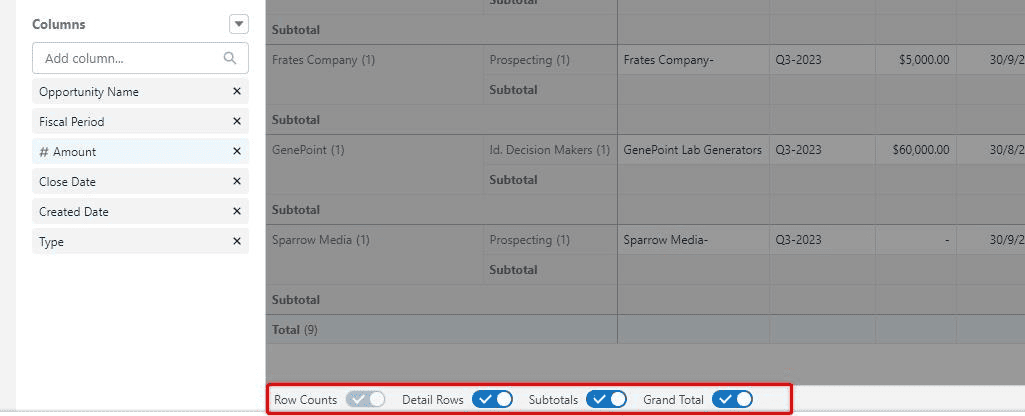
Though I have no need to alter them in this report, at the bottom of the report builder you can toggle which detail/total rows appear on the report.
If you want a really tight report, with less spacing, removing some of the total columns can make a big difference.
6. Filtering The Report Records
Now I have the report configured to my preferences, I need to make sure that the report includes the relevant Opportunities. I can now move from the Outline tab to the Filtering options.
In this case, I want to capture every opportunity record, old and new, because the purpose is to see the opportunity history for each account. Depending on the object your report is based on, there will be some default filters you must configure, as well as the option of adding further filters.
If your Salesforce Org has a very large number of records, then you might need to be more stringent with report filters to really narrow down to ONLY the records, you want to be included.
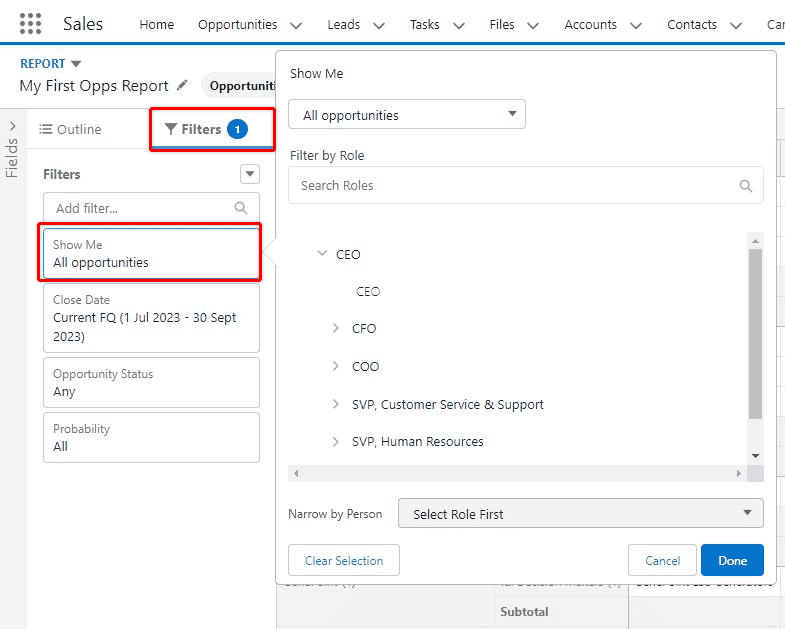
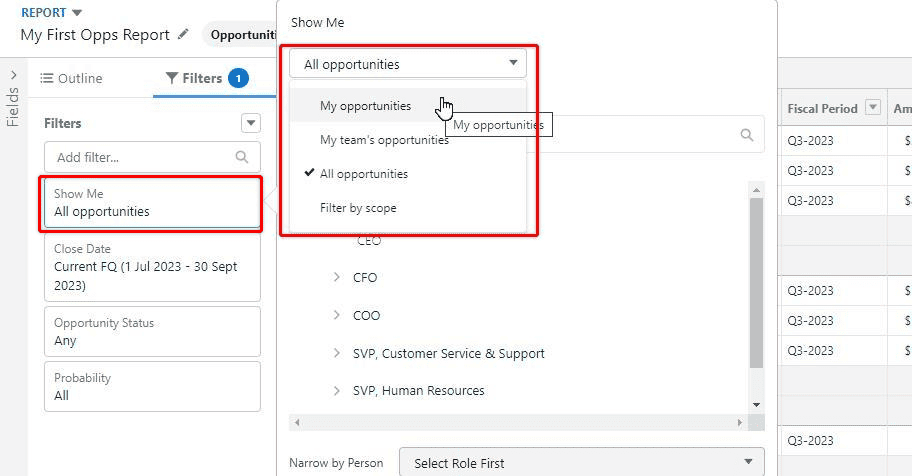
For this report I wish to see all Opportunities, and not restrict the list by who the owner is, or the role of the owner, so for Show Me, I am selecting All Opportunities.
However, if you wanted to create a dynamic report that could be used by other people, and just show them the opportunities that they themselves own, then you could configure this option to ‘My Opportunies’ and it will only display the owned Opportunities of whoever is looking at this report.
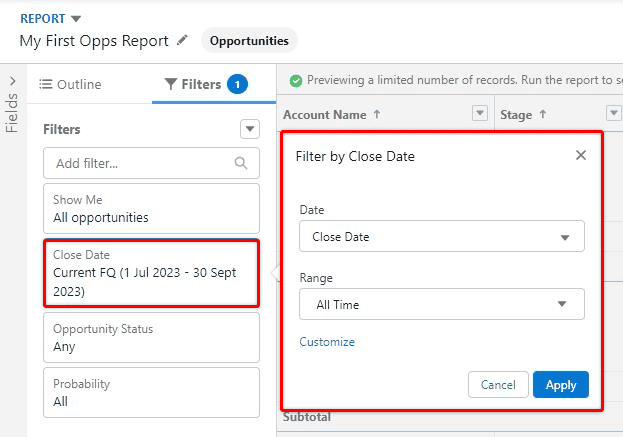
I could choose a range of date parameters to use in my filtering, but for the purposes of this report, using the Opportunity Close Date, and setting the Range to ‘All Time’ is most suitable.
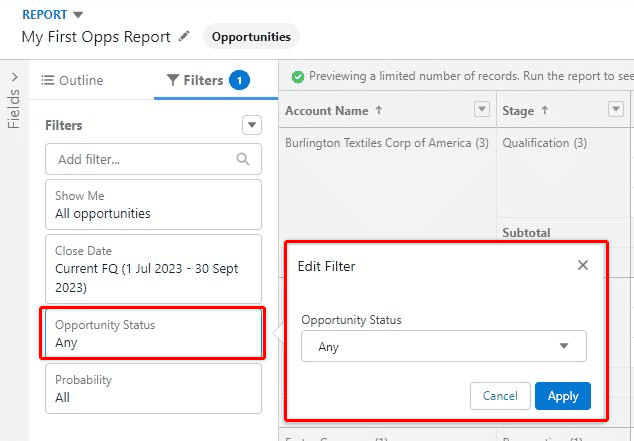
Regarding Opportunity Status and Probability, I am going to select all possible records to be included.
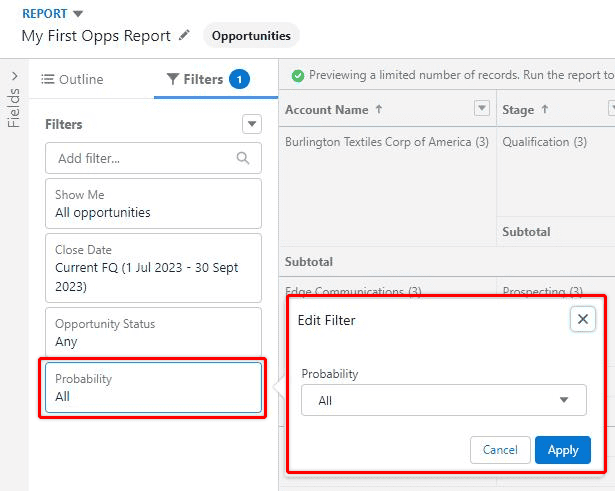
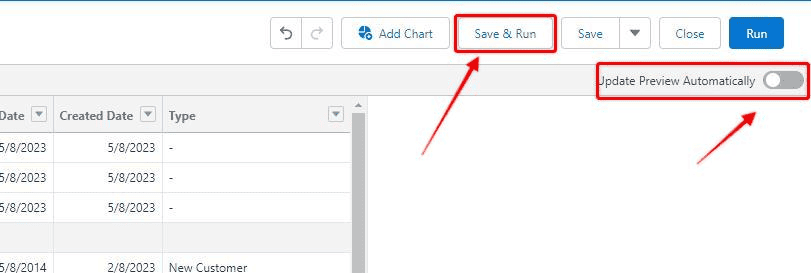
Now the default report filters have been configured I can Save and Run, my report. You can also toggle the Update Preview Automatically option if you want to see your report change in real time as you edit it.
This can work okay if you are working with a small number of records, but if your report is capturing a large number of records, this can slow down your report-building process as it will take a few seconds to reconfigure itself every time.
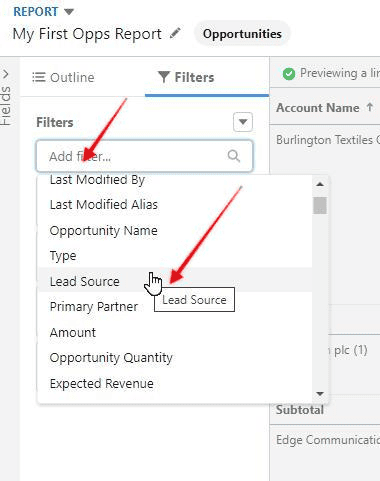
Though I did not want any custom filters on this report, by choosing Add Filter you can filter your report in more ways, depending on your requirements.
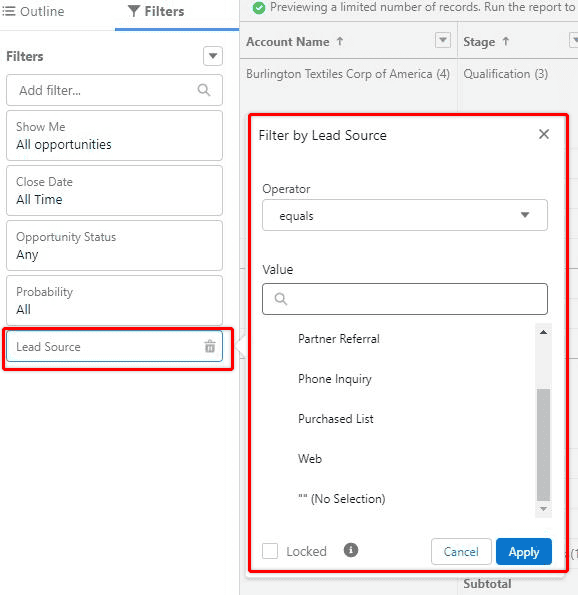
For example, if I wanted to see which Opportunities arose from a certain Lead Source, to try and understand which types of Leads might be most profitable, I could select Custom Filter, scroll down to Lead Source from the list, and then choose which source I wanted to filter by.
7. Save the Report
When you save your report, you will be asked for a name, a unique name (automatically generated initially), a report description, and which folder you want to save the report into.
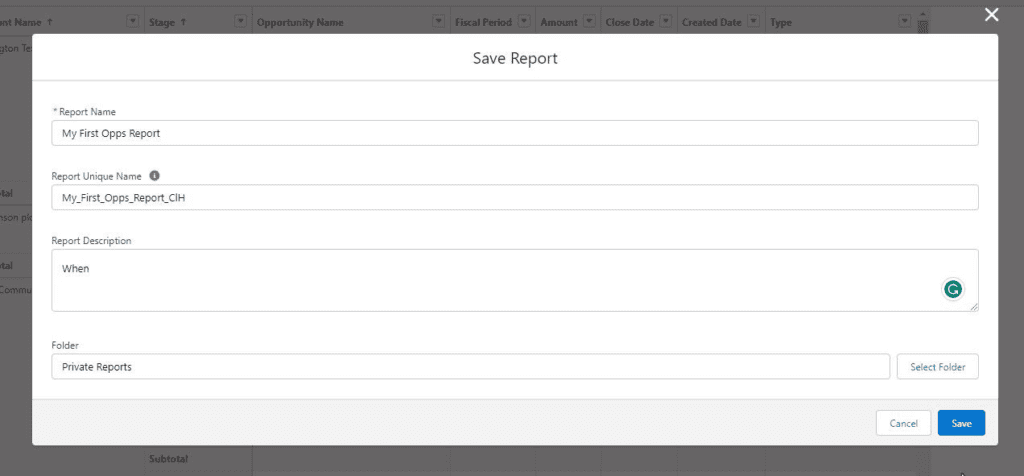
Make both the report name and description as information as possible to both remind you of the purpose of the report and also to help other users understand the nature of the report and what value it provides.
The folder that you save a report to impact who else can see and use the reports you create. If you want a report to be available to other Salesforce users in your Org, then you need to save it to a public report folder (discussed in detail in the following section).
Once you have saved your report into a folder (Private or Public) you will be able to see it, in full for the first time and see whether it meets the intended purpose.
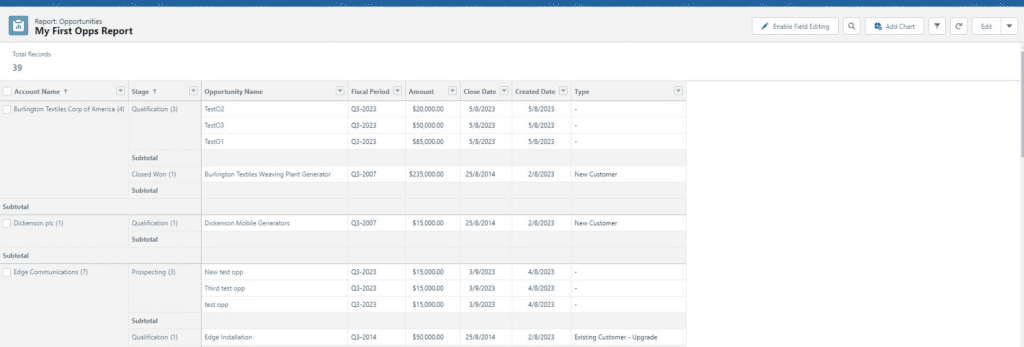
From this view, you can enable the ability to edit fields inside of the report, add a chart to visualize the data (without the need for a Dashboard), or choose Edit to go back to the Report Builder and make changes to the fields and filtering of the report.
Sharing a Salesforce Report With Other Users
The way that you share a Salesforce Report with other users, is by saving that report into a Public Folder.
Once it is saved in a public folder, you need to ensure that the relevant people who need access to that report, have access to that Salesforce folder.
There are a variety of different permissions that can be given to people to administer who can see report folders, and what they can do with them. This Salesforce Help article explains the different permissions well
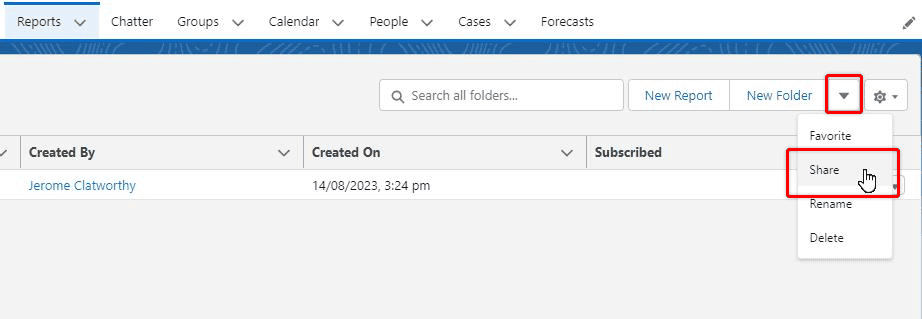
If have the ability to share access to a report folder, you do it by opening up the Reports app and finding the relevant folder. and opening it.
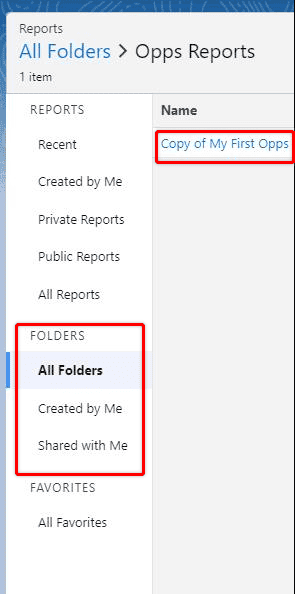
Once the folder is open, choose the downward pointing arrow to open the Sharing Settings for the folder.
You can share a Salesforce Report Folder with particular users, users with certain roles, users with roles, and public groups (if they have been set up).
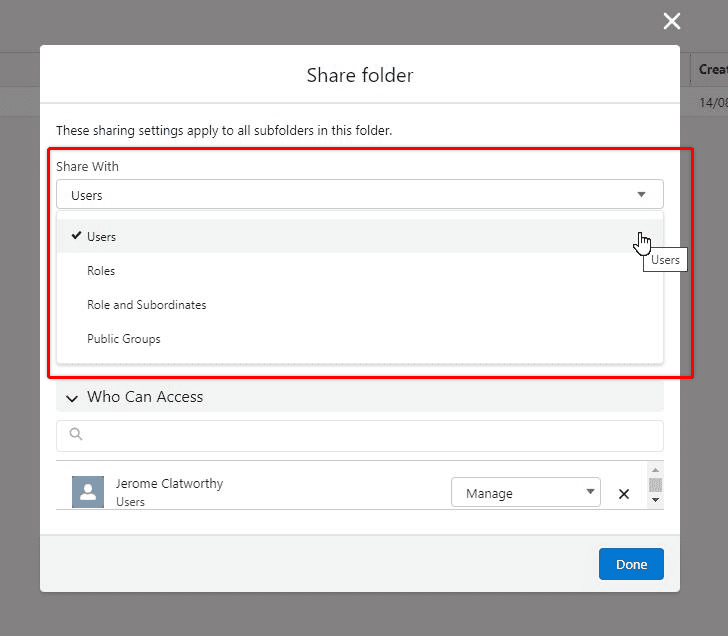
For each person, role, or group that you share the folder with, you also indicate whether they can view/edit or manage the folder as well.
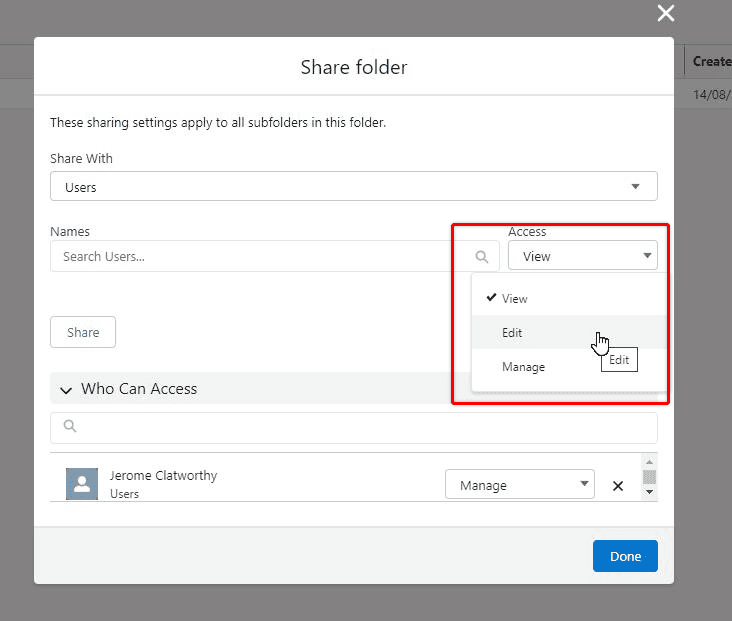
The users, roles, and groups that you set up, will now be able to access the reports that are saved in that folder, with the type of access that was granted. You can edit and update the sharing settings at any time.
Salesforce Report Subscriptions
You can set up Salesforce Report Subscriptions and have a particular report emailed to you, or to someone else on a periodic basis.
It could be that a Sales Manager wants to receive a list of Opportunities that have not been contacted in a while, or as the Salesforce Administrator you want to email yourself a list of inactive users, so you can deactivate them and save on licensing costs.
To set up a Salesforce Report Subscription, select the downward arrow in the top right-hand side, when a report is open and select Subscribe.
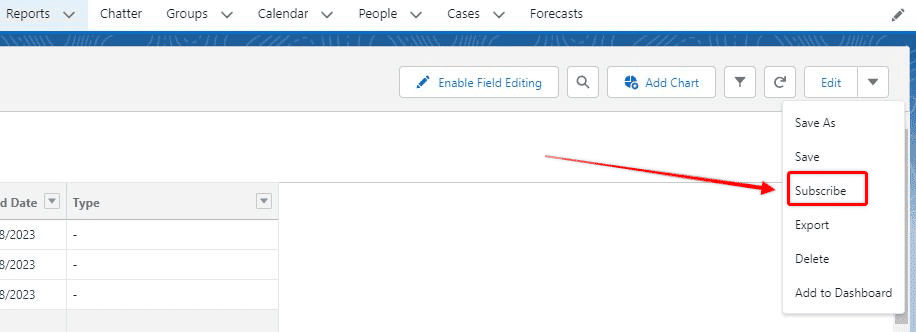
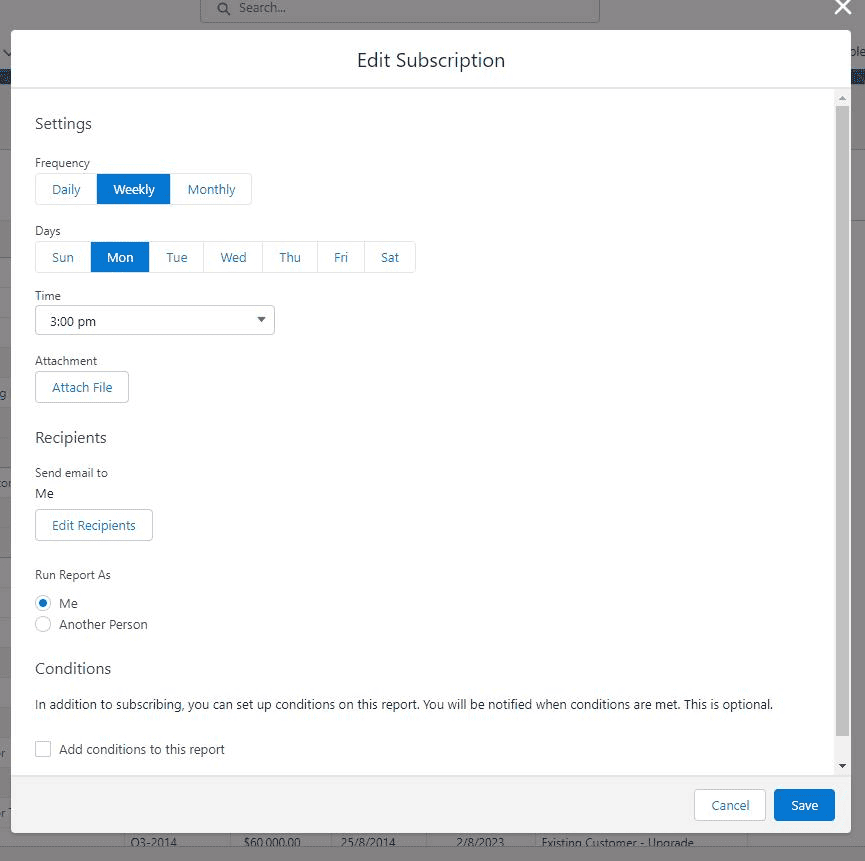
A pop-up window will open up so that you can then configure the nature of the subscription.
Along with typical information such as the desired frequency of the report, and which users need it, you can also configure who the report should be run as, and if you want any other conditions to be met before the scheduled report is sent out.
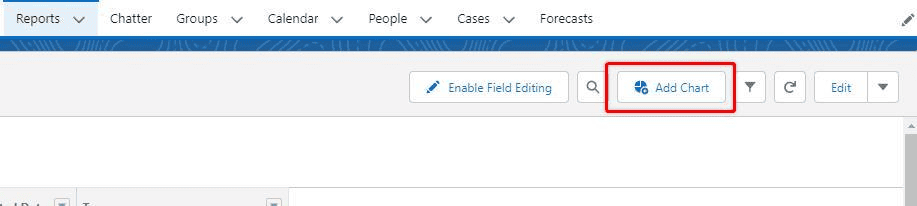
Adding Charts to Salesforce Reports
Dashboards are the primary way to visualize data in Salesforce, however, there are some limited but effective options to visualize data directly on a report, without the need for an additional Dashboard.
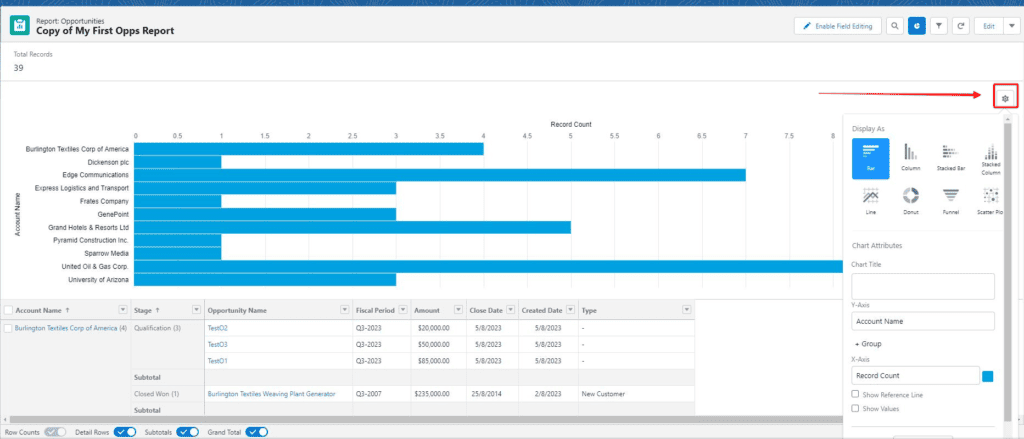
With the report open, choose Add Chart from the upper right-hand side, and a chart will open up, at the top of the report immediately.
This may not be the chart, or perspective you were hoping for, so select the Gear Icon, on the right-hand side of the chart to open up the chart settings.
From there you can select your desired chart type, which data is on which axis, and whether you want additional information (such as a reference line, or field values) included.