Joined Salesforce reports allow you to combine up to five report blocks, each with customizable data, summaries, and custom formulas sorted by the filters of your choice.
With joined reports, you can easily create multiple views of your data, which is especially useful for identifying trends, comparing data, and gaining insights into your business.
Creating a Salesforce joined report is a straightforward process that involves selecting the report type, choosing the report format, adding report blocks, and customizing the data, filters, and formulas.
Once you’ve created your report, you can analyze the data and gain insights into your business. Whether you’re looking to identify trends, compare data, or gain insights into your business, Salesforce joined reports are a powerful tool that can help you achieve your goals.
Table of Contents
- Key Takeaways
- Understanding Salesforce Joined Reports
- Components of Salesforce Joined Reports
- Creating Salesforce Joined Reports
- Analyzing Data with Salesforce Joined Reports
- Application of Salesforce Joined Reports
- Salesforce Joined Report Frequently Asked Questions
- What are the limitations of joined reports in Salesforce?
- How do I create a joined report in Salesforce?
- What is the difference between a matrix and a joined report in Salesforce?
- How can I troubleshoot errors in a Salesforce joined report?
- What is a cross-block formula in a Salesforce joined report?
- Can I create a chart from a Salesforce joined report?
Key Takeaways
- Salesforce joined reports allow you to get a broad view of your data across objects or conditions.
- Joined reports consist of report blocks, fields, filters, and summary formulas.
- Creating a Salesforce joined report involves selecting the report type, choosing the report format, adding report blocks, and customizing the data, filters, and formulas.
Understanding Salesforce Joined Reports

What is Salesforce Joined Report?
Salesforce Joined Reports help you combine data from multiple reports into a single report. In other words, you can create a report that shows data from two or more report types. This allows you to analyze data from different angles and get a more complete picture of your business.
In a joined report, you can group and summarize data from each report type and display them in separate sections. You can also filter and sort data based on different criteria.
For example, you could create a Joined Report that shows the number of leads by source and the number of opportunities by stage.

Importance of Salesforce Joined Reports
Salesforce Joined Reports are important because they make it possible to look at multiple different reports, that have something in common, at the same time
This can help you make better decisions and take action based on insights that you might have missed with a single report.
Bringing multiple reports together into a single report is not only more efficient for the report viewer, but it provides a more holistic perspective of your data and provides insights that may not have been so obvious if you looked at the same data across multiple reports.
RELATED RESOURCE: Getting Data Driven Insights Using Salesforce Reports
Components of Salesforce Joined Reports
Report Blocks
Report blocks are the building blocks of a Salesforce joined report. Each block contains a set of fields, columns, and summary data that are displayed in the report. You can add up to five report blocks to a single joined report.
Grouping
Grouping is the process of organizing data in a report by a specific field. In a joined report, you can group data within each report block and across all report blocks. Grouping can be done by any field that is included in the report blocks.
Filters
Filters are used to limit the amount of data that is displayed in a report. In a joined report, you can apply filters to each report block and across all report blocks. Filters can be applied to any field that is included in the report blocks.
Formulas
Formulas are used to calculate custom values based on the data in a report. In a joined report, you can create formulas for each report block and across all report blocks. Formulas can be used to calculate custom fields, perform calculations on existing fields, and more.
Creating Salesforce Joined Reports
In this section, we’ll explore how to create a joined report in Salesforce.
Report Builder
First, navigate to the Reports tab and select the New Report button.
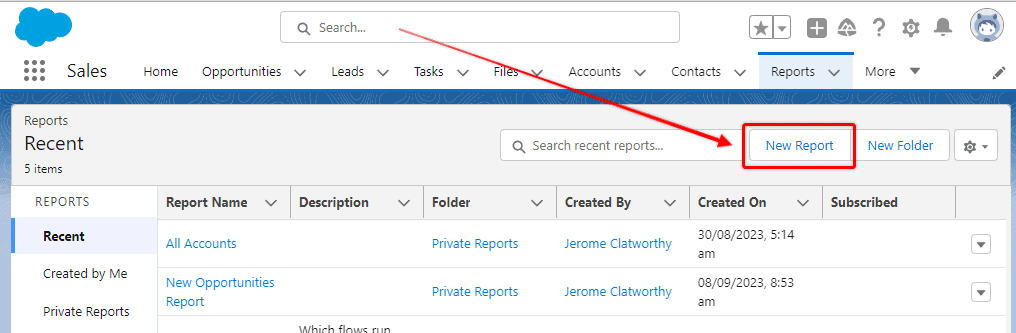
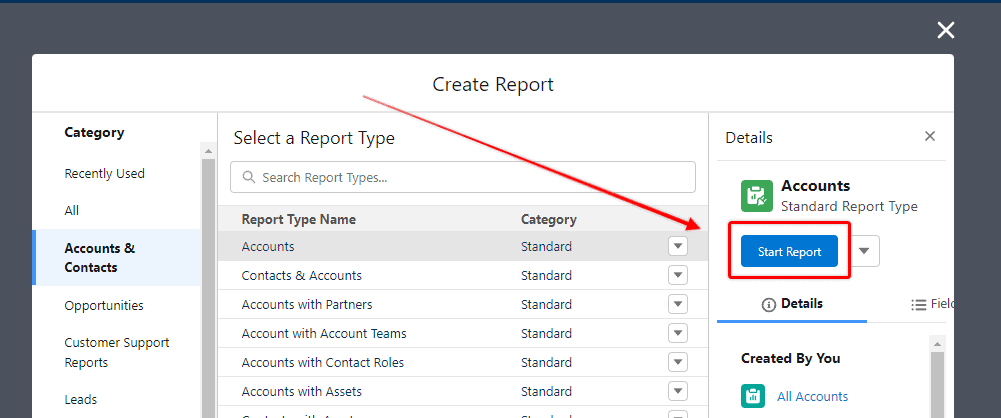
From here, you’ll be taken to the Report Builder. Select the primary report type that you want to use for your joined report. This will be the object that you want to focus on in your report.
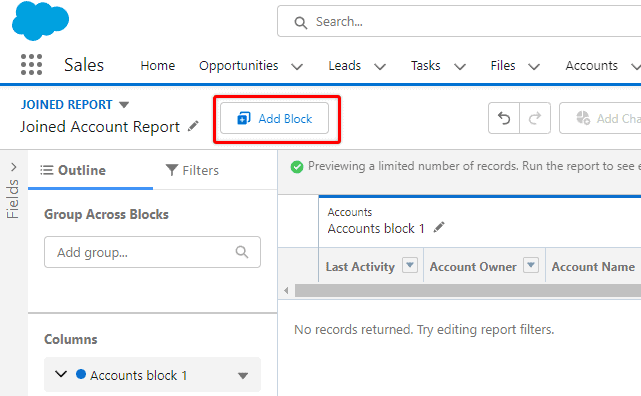
Adding Report Blocks
Once you’ve selected your primary report type, you can add additional report blocks to your joined report.
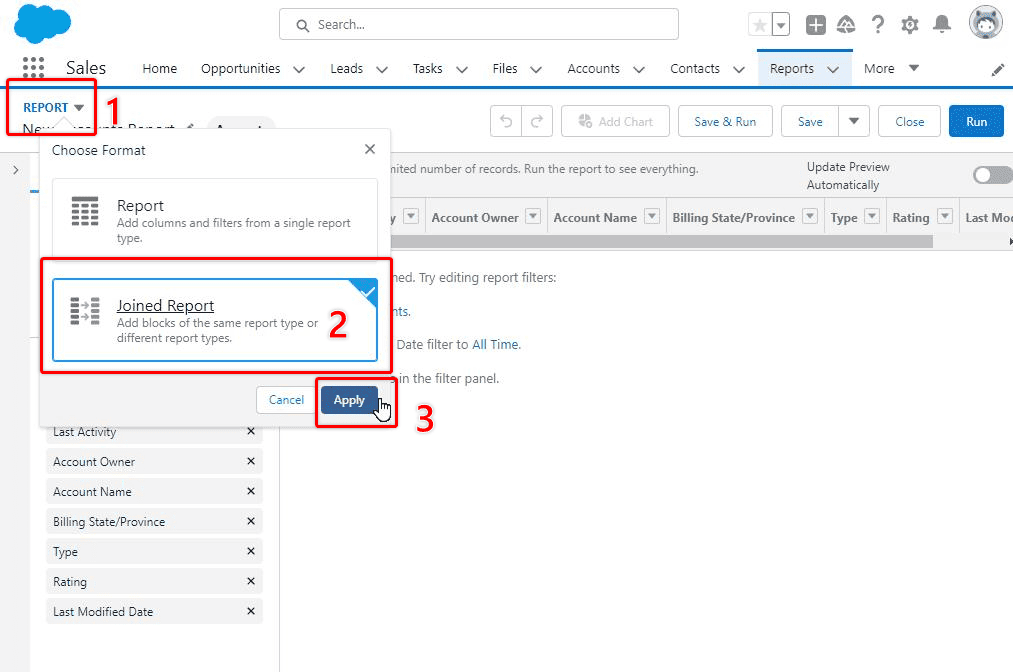
To convert your report into a joined report click on Report, and select Joined Report, then Apply.
These report blocks will allow you to include data from other objects in your report. To add a report block, click on the “Add Block” button in the Report Builder.
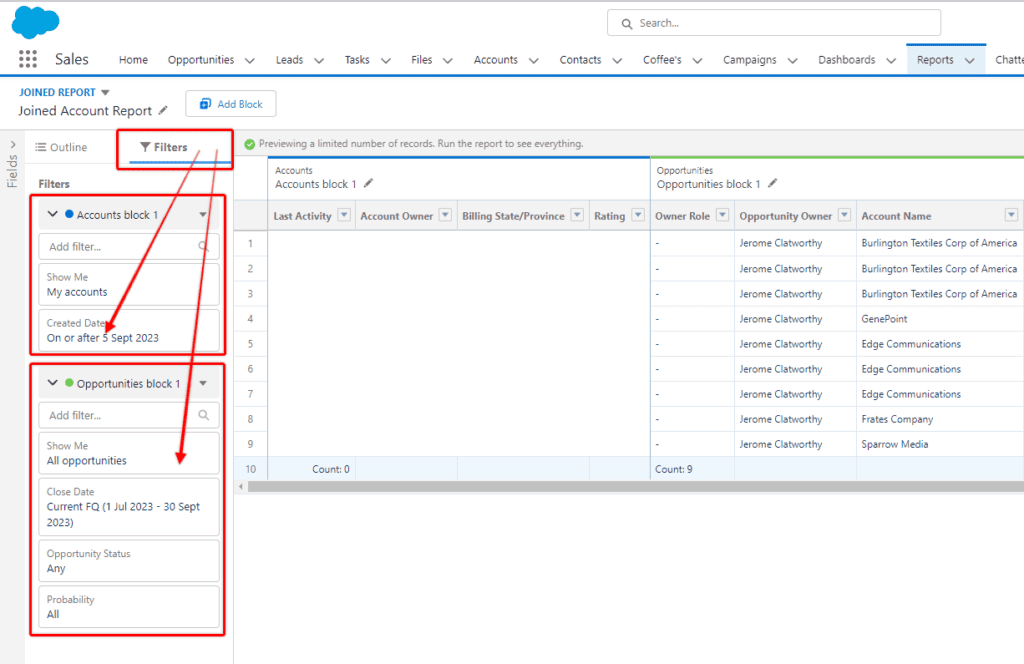
Setting Conditions
To make your joined report more specific and targeted, you can add conditions to each report block. These conditions will filter the data that is included in each report block.
To add a condition, select the Filters heading to open the Filters tab. By adjusting the filters for each report, you can narrow down the records that appear on your report.
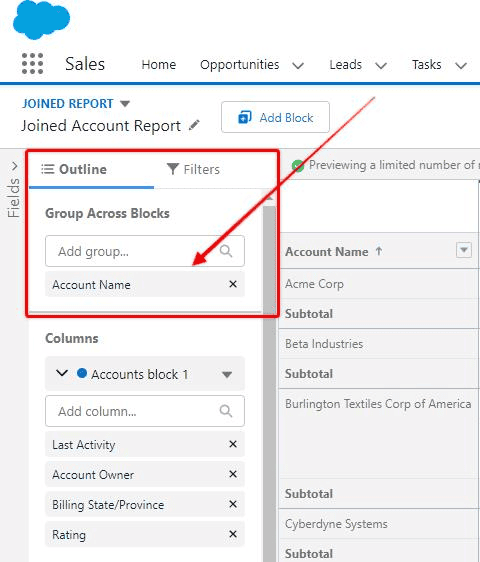
Grouping Data in Your Salesforce Joined Reports
One of the advantages that joined reports provides is the ability to group the reports by fields that the reports have in common.
It is not possible to add reports to a joined report if it does not have a field in common with the other reports already on the report.
Common fields used to group joined reports are things like Account Name and Record Owner.
To add a group to a Salesforce Joined Report, drag a field name to the Group Access Blocks section.
Adding a Grouping to your joined report also gives you the chance to add a chart to your Joined Report. If your report has no grouping, you will not be able to add a Report Chart to your joined report.
Adding Charts to Your Joined Salesforce Report
KEY CONCEPT
Before you can add a chart to your joined report, you will need to have the report grouped in some way.
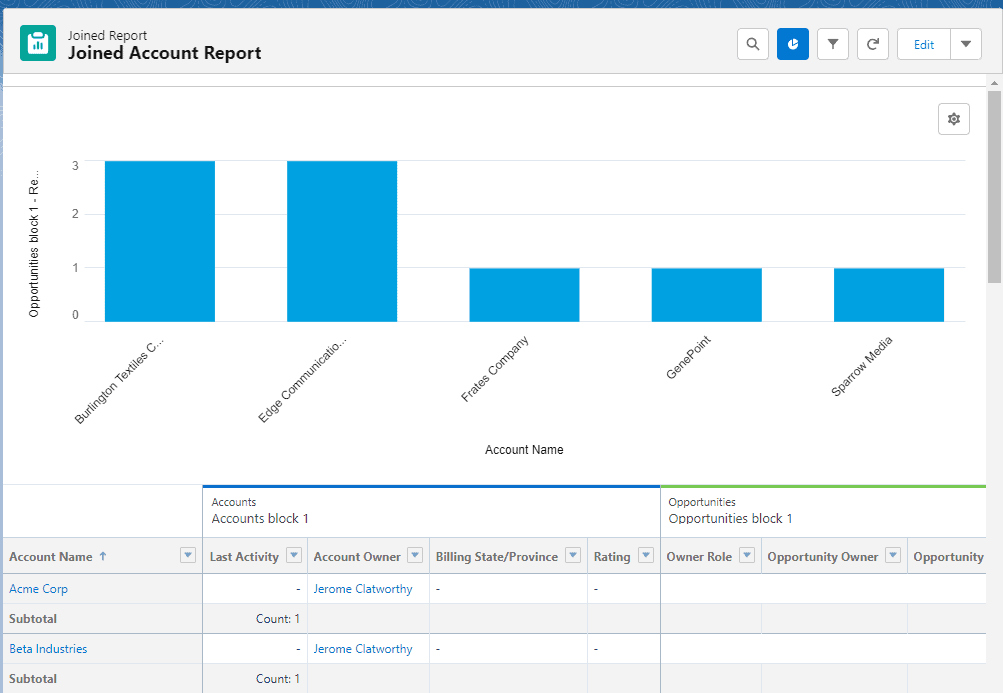
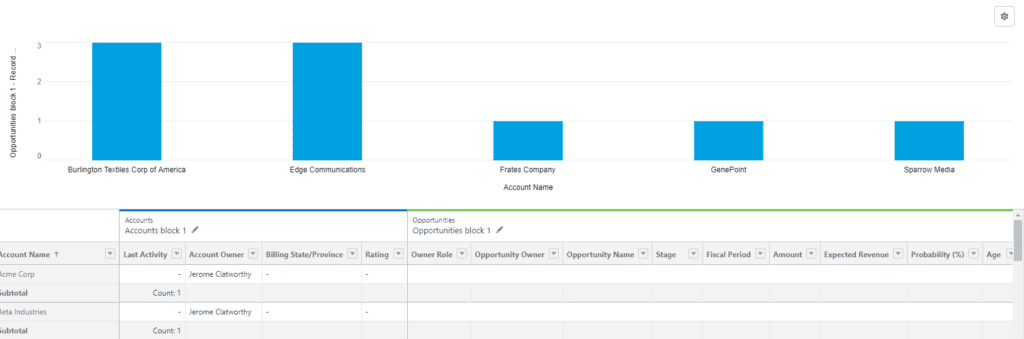
In my sample report, I have the report group by Account Name.
Once you have your joined report grouped by a certain field, the Toggle Chart button will be available at the top of your report.
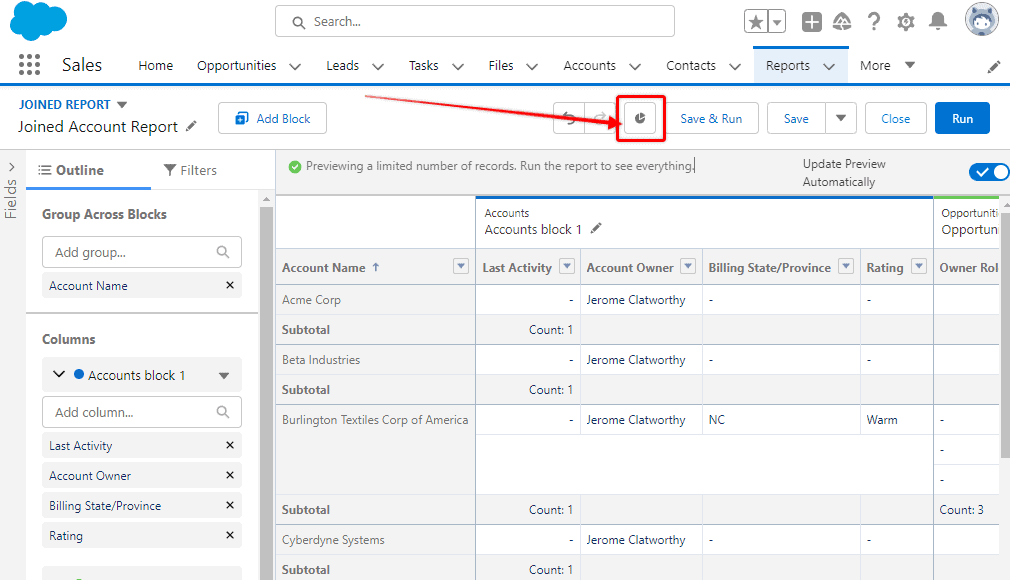
When you select the Toggle Chart button, a chart will appear at the top of your report that you can then configure.
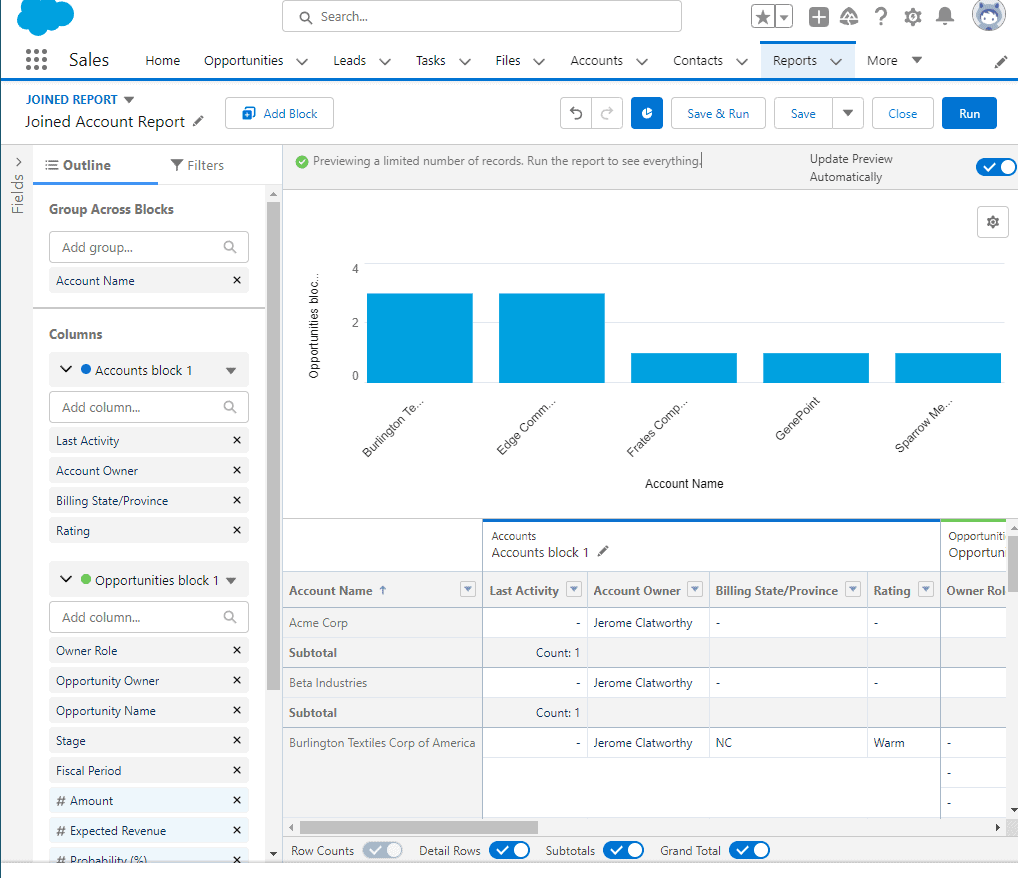
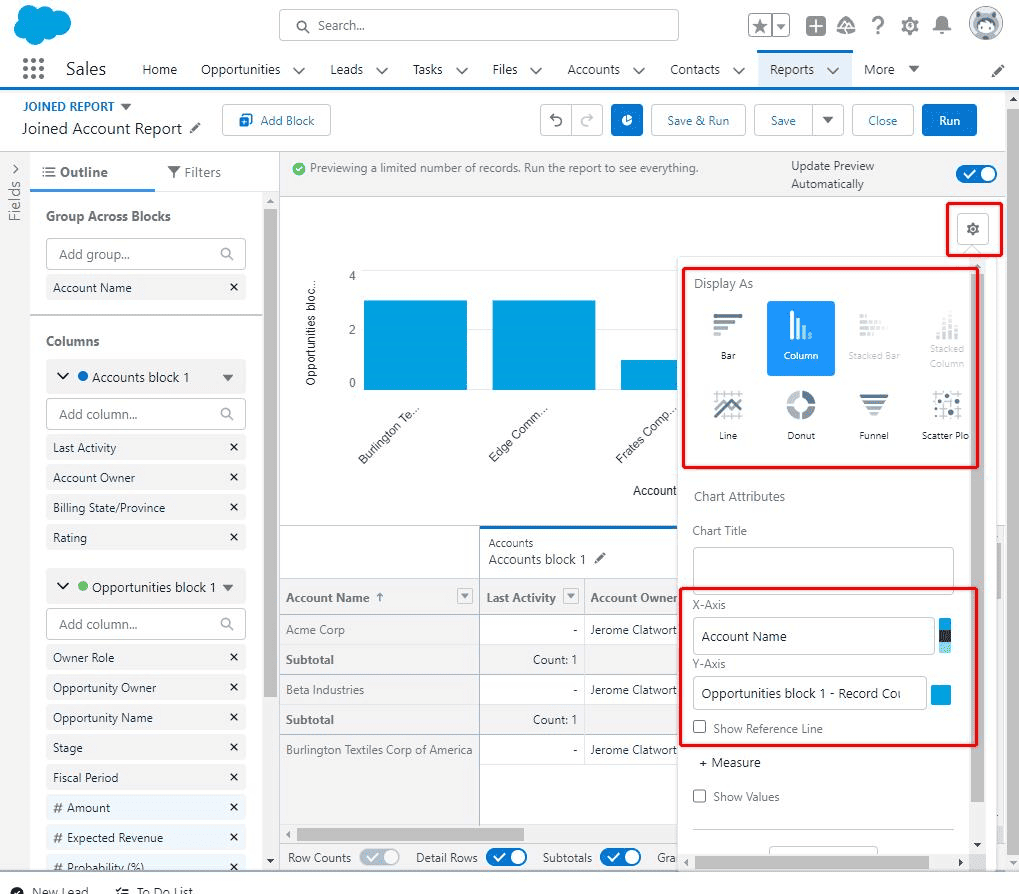
Once your chart has been toggled on, select the gear icon to configure your chart. You can choose the chart type, and alter which data is displayed on the X and Y axis.
Analyzing Data with Salesforce Joined Reports
Salesforce joined reports allow you to combine data from multiple reports into a single report. This can be incredibly useful when you need to analyze data from different objects or when you need to compare data under different conditions.
In this section, we will discuss how to analyze data with Salesforce joined reports.
Using Charts
One of the benefits of using Salesforce joined reports is that you can use charts to visualize your data. Charts can help you identify trends and patterns in your data that might not be immediately apparent from a table.
To create a chart in a joined report, select the Toggle Chart button in the top menu. From there, you can choose the type of chart you want to create and customize its appearance.
Understanding Performance
When working with large data sets, performance can be a concern. Fortunately, Salesforce joined reports are designed to handle large amounts of data without sacrificing performance.
However, there are a few things you can do to optimize the performance of your joined reports.
First, try to limit the number of fields you include in your report. Including too many fields can slow down the report’s performance. Second, use filters to limit the amount of data that needs to be processed.
Finally, consider using summary fields to aggregate data and reduce the amount of data that needs to be processed.
Application of Salesforce Joined Reports

In this section, we will discuss some of the ways in which you can use Salesforce Joined Reports to gain insights into your data.
Account Reports
One of the most common uses for Salesforce Joined Reports is to analyze data related to accounts. By using a Joined Report, you can combine data from multiple account-related objects, such as contacts, opportunities, and cases, into a single report.
This can give you a comprehensive view of all the interactions your organization has had with a particular account.
For example, you could create a Joined Report that includes data from the Account, Contact, and Opportunity objects. You could then group the report by account name and include columns for the total number of contacts associated with each account, the total value of all opportunities associated with each account, and the total amount of revenue generated by each account.
Cases Report Type
Another common use for Salesforce Joined Reports is to analyze data related to cases. By using a Joined Report, you can combine data from multiple case-related objects, such as accounts, contacts, and products, into a single report. This can help you identify trends and patterns in your customer support interactions.
For example, you could create a Joined Report that includes data from the Case, Account, and Contact objects. You could then group the report by case status and include columns for the total number of cases in each status, the average time to resolution for cases in each status, and the total number of cases associated with each account.
Opportunities Analysis
Salesforce Joined Reports can also be used to analyze data related to opportunities. By using a Joined Report, you can combine data from multiple opportunity-related objects, such as accounts, contacts, and products, into a single report.
This can help you identify trends and patterns in your sales interactions.
For example, you could create a Joined Report that includes data from the Opportunity, Account, and Contact objects.
You could then group the report by opportunity stage and include columns for the total value of all opportunities in each stage, the average time to close for opportunities in each stage, and the total number of opportunities associated with each account.
By using Joined Reports to analyze data related to accounts, cases, and opportunities, you can identify trends and patterns that can help you make informed business decisions.
Salesforce Joined Report Frequently Asked Questions
What are the limitations of joined reports in Salesforce?
Joined reports have some limitations, such as the inability to include more than five report blocks or display more than 2,000 rows of data. Additionally, joined reports do not support cross-filters, bucket fields, or dynamic dashboards.
How do I create a joined report in Salesforce?
To create a joined report in Salesforce, you must first navigate to the Reports tab and click “New Report.” From there, you can select the report type you want to use as your primary report and choose the “Joined” report format. You can then add additional report blocks and configure your report settings as needed.
What is the difference between a matrix and a joined report in Salesforce?
Matrix reports allow you to group data by both rows and columns, while joined reports allow you to combine data from multiple report types into a single report. Matrix reports are better suited for analyzing data that can be organized into a grid, while joined reports are more flexible and can be used to combine data from a variety of sources.
How can I troubleshoot errors in a Salesforce joined report?
If you encounter errors while working with a joined report in Salesforce, you can try refreshing your report or adjusting your report settings. You can also check the Salesforce Help Center or reach out to Salesforce support for additional assistance.
What is a cross-block formula in a Salesforce joined report?
A cross-block formula is a formula that references data from more than one report block in a joined report. Cross-block formulas can be used to perform calculations or create custom fields that combine data from different sources.
Can I create a chart from a Salesforce joined report?
Yes, you can create a chart from a Salesforce joined report by selecting the “Chart” option from the “Tools” menu in the report builder. From there, you can choose the chart type you want to use and configure your chart settings as needed.