Salesforce dashboards are a powerful tool that allows you to visualize and analyze your data in real time.
With Salesforce Dashboards, you can easily track your business performance, identify trends, and make data-driven decisions.
Understanding Salesforce dashboards is key to unlocking their full potential. Salesforce dashboards are made up of components such as charts, tables, and metrics, which can be customized to suit your specific needs.
You can also use filters to drill down into your data and get a more detailed view of your business performance.
Additionally, Salesforce dashboards can be shared with your team members, allowing everyone to stay on the same page and work towards common goals.
In this article, I will explore and explain the key components of Salesforce Dashboards, as well as the impact they can have on your business.
I will also look at how Salesforce Dashboards can be leveraged for reliable data and sales management, as well as their role in Lightning Experience.
Table of Contents
- Salesforce Dashboard Key Takeaways
- WHAT IS A SALESFORCE DASHBOARD?
- The Impact of Salesforce Dashboards
- Creating a Salesforce Dashboard
- Components of a Salesforce Dashboard
- Sharing a Salesforce Dashboard
- Understanding Permissions and Sharing in Salesforce Dashboards
- Dynamic Dashboards
- Salesforce Dashboards in Lightning Experience
- Leveraging Salesforce Dashboards for Reliable Data
- Role of Salesforce Dashboards in Sales Management
- Salesforce Dashboard Frequently Asked Questions
Salesforce Dashboard Key Takeaways
- Salesforce dashboards are a powerful tool for visualizing and analyzing your data in real time.
- Understanding the key components of Salesforce dashboards is essential to unlocking their full potential.
- Leveraging Salesforce dashboards can help you achieve reliable data and effective sales management, among other benefits.
WHAT IS A SALESFORCE DASHBOARD?
A Salesforce dashboard is a visual representation of key metrics and data points that provide users with a real-time snapshot of their business performance.
Salesforce Dashboards are a customizable display of charts, tables, and graphs that can be created using data from reports based on any standard or custom object in the Salesforce platform.
The Impact of Salesforce Dashboards
Salesforce dashboards have a significant impact on your business by providing real-time visibility into your data. With dashboards, you can quickly identify trends, sort out quantities, and measure the impact of your activities. Here are some of the ways Salesforce dashboards can impact your business:
Improved Decision Making
Salesforce dashboards provide a visual representation of your data, making it easy to analyze and understand.
With dashboards, you can quickly identify trends and patterns in your data, allowing you to make informed decisions. For example, you can use a sales dashboard to identify your top-performing sales reps, which products are selling the most, and which regions are underperforming.
This information can help you make strategic decisions about where to focus your resources and how to improve your sales process.
Increased Productivity
Salesforce dashboards can help increase productivity by providing real-time visibility into your data. With dashboards, you can quickly see which tasks are overdue, which cases are open, and which opportunities are at risk of slipping.
This information can help you prioritize your work and ensure that you are focusing on the most critical tasks.
Better Collaboration
Salesforce dashboards can help improve collaboration by providing a shared view of your data. With dashboards, you can share real-time data with your team, allowing everyone to stay on the same page.
For example, you can use a service dashboard to share information about open cases, escalation trends, and customer satisfaction scores. This information can help your team work together more effectively and provide better service to your customers.
Improved Customer and Stakeholder Satisfaction
Salesforce dashboards can help improve customer satisfaction by providing real-time visibility into customer data.
With dashboards, you can quickly see which customers are at risk of churning, which customers are the most profitable, and which customers are the most satisfied.
This information can help you identify opportunities to improve your customer experience and increase customer loyalty.
Creating a Salesforce Dashboard
Creating a Salesforce dashboard is a simple process. To create a dashboard, you will need to create one or more reports that contain the data you want to display.
Once you have created your reports, you can add them to your dashboard and customize the layout and appearance of your dashboard.
Click here for a step-by-step guide on creating a Salesforce Dashboard.
Components of a Salesforce Dashboard
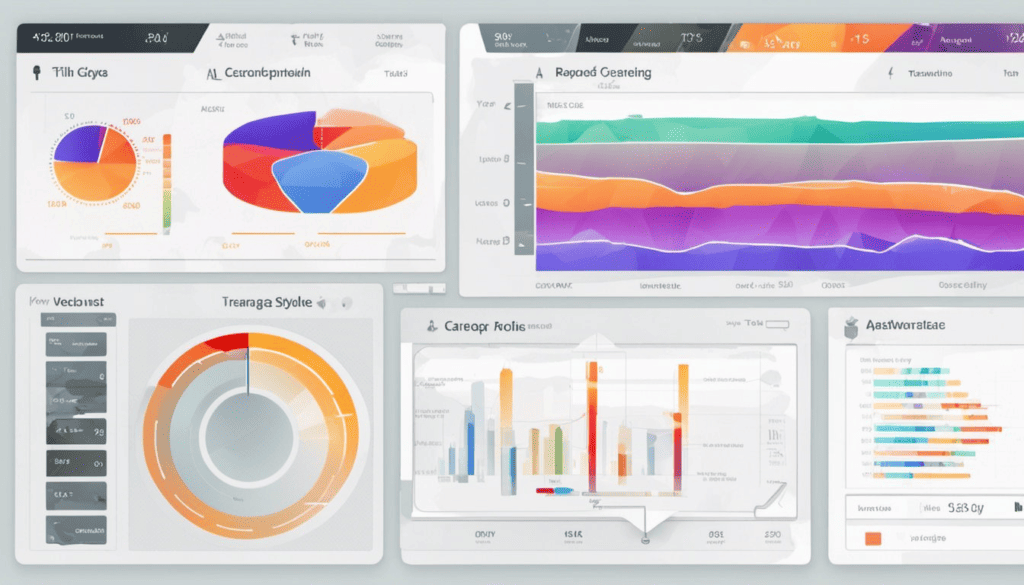
A Salesforce dashboard is made up of several components, each of which displays a different type of data.
Some of the most common components of a Salesforce dashboard include:
- Charts: Charts display data in a graphical format, such as a pie chart, bar chart, or line chart.
- Tables: Tables display data in a tabular format, allowing you to see detailed information about your data.
- Gauges: Gauges display a single value, such as a percentage or a dollar amount, in a visual format.
- Metrics: Metrics display a single value, such as a count or an average, in a numerical format.
Sharing a Salesforce Dashboard
Once you have created your Salesforce dashboard, you can share it with other users in your organization. You can share your dashboard with individual users, groups of users, or with everyone in your organization.
You can also control the level of access that each user has to your Salesforce dashboard, allowing you to keep your data secure.
THINGS YOU WILL NEED
To share a Salesforce Dashboard you will need the ‘Manage Dashboards in Public Folders’ permission.
Understanding Permissions and Sharing in Salesforce Dashboards
When it comes to Salesforce dashboards, understanding permissions and sharing is crucial.
Permissions determine what users can do with dashboards while sharing controls and who can access them. In this section, we’ll take a closer look at permissions and sharing in Salesforce dashboards.
Permissions
Salesforce provides a variety of permissions that control what users can do with dashboards.
These permissions can be set at the profile, permission set, or individual user level. Some of the key permissions related to dashboards include:
- View Dashboards: Determines whether a user can view dashboards.
- Create and Customize Dashboards: Determines whether a user can create and customize dashboards.
- Schedule Dashboards: Determines whether a user can schedule dashboards to run at specific times.
- Subscribe to Dashboards: Determines whether a user can subscribe to dashboards and receive updates via email.
It’s important to carefully consider which permissions to grant to users based on their roles and responsibilities within the organization.
Sharing
Sharing controls who can access dashboards. Salesforce provides several options for sharing dashboards, including:
- Public Sharing: Allows anyone with the link to access the dashboard. This option should be used with caution, as it can expose sensitive data.
- Role-Based Sharing: Allows users with specific roles to access the dashboard. This is a good option for sharing dashboards with a specific department or team.
- Group-Based Sharing: Allows users in specific groups to access the dashboard. This is a good option for sharing dashboards with a specific project team.
- Individual Sharing: Allows specific users to access the dashboard. This is a good option for sharing dashboards with a small group of people.
When sharing dashboards, it’s important to consider the sensitivity of the data and ensure that only authorized users have access.
Dynamic Dashboards
Dynamic dashboards make it possible for the data someone sees to inherit their typical record access permissions, without needing to create separate dashboards for different groups of people.
For example, if you create a Dashboard about Accounts, and want each user to see only the accounts that they own, on their dashboard, creating a Dynamic Dashboard that shows the user ‘My Accounts’ will automatically restrict the records that they see, based on the records that they are the owner of in Salesforce.
There are different dynamic settings you can configure to best suit your business use case.
Salesforce Dashboards in Lightning Experience
Salesforce Dashboards in Lightning Experience allow you to visualize your data in real-time and make informed business decisions.
With the Lightning Dashboard Builder, you can create custom dashboards with various chart types, tables, metrics, and gauges. Here’s what you need to know about Salesforce Dashboards in Lightning Experience:
Creating and Customizing Dashboards
To create a dashboard in Lightning Experience, you can use the Lightning Dashboard Builder.
You can add dashboard components to your dashboard, such as charts, tables, and metrics, and customize how data is grouped, summarized, and displayed for each component.
You can also sort data in dashboard components and color dashboard data with themes and palettes.
Accessing Dashboards
In Lightning Experience, you can access your dashboards from the App Launcher or from the Dashboards tab. You can also subscribe to dashboards to receive updates on a regular basis.
Sharing Dashboards
You can share your dashboards with other users in your organization or with external users. You can control who can view, edit, and manage your dashboards by setting up sharing rules and permissions.
Using Dashboards for Analytics
Salesforce Dashboards in Lightning Experience can be used for analytics to analyze your data and gain insights into your business. You can use dashboards to track key performance indicators (KPIs), monitor sales trends, and identify areas for improvement.
Leveraging Salesforce Dashboards for Reliable Data
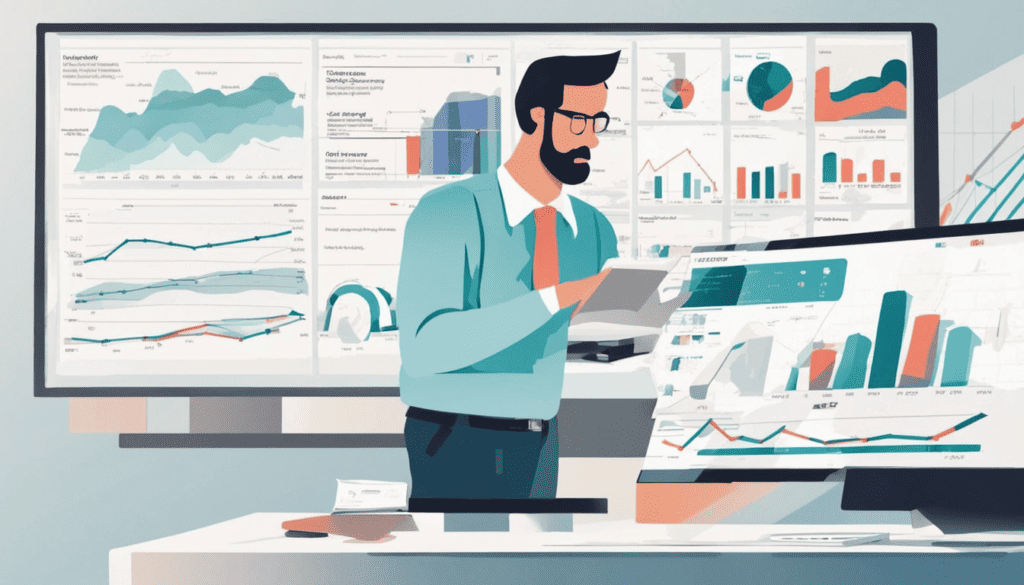
Salesforce dashboards are an essential tool for businesses to obtain reliable data. They allow you to visualize complex data, identify trends, and make informed business decisions.
With the right configuration, Salesforce dashboards can provide you with a real-time snapshot of your business.
To leverage Salesforce dashboards for reliable data, you need to follow some best practices. Here are some tips:
1. Define Your Objectives
Before creating a dashboard, you need to define your objectives. What data do you want to track? What are your KPIs? What insights do you want to gain from the dashboard?
By answering these questions, you can design a dashboard that meets your specific needs.
2. Use Relevant Data
To ensure that your dashboard provides reliable data, you need to use relevant data. This means that you should only include data that is necessary for your objectives.
Including irrelevant data can lead to confusion and inaccurate insights.
3. Choose the Right Chart Type
Choosing the right chart type is crucial to ensure that your dashboard is easy to read and understand. For example, if you want to show trends over time, you should use a line chart.
If you want to compare data, you should use a bar chart. Using the wrong chart type can make it difficult to interpret the data.
4. Keep it Simple
When designing a dashboard, it’s important to keep it simple. A cluttered dashboard can be overwhelming and confusing.
Stick to the most important KPIs and data points, and use formatting to highlight the most critical information.
5. Regularly Review and Update
To ensure that your dashboard provides reliable data, you need to regularly review and update it. As your business changes, your objectives and KPIs may change as well.
By regularly reviewing and updating your dashboard, you can ensure that it remains relevant and provides accurate insights.
Role of Salesforce Dashboards in Sales Management

Salesforce dashboards are powerful tools that can be used by sales managers and representatives to monitor and analyze sales performance.
These dashboards provide a visual representation of important sales data, making it easier to identify trends and areas for improvement.
For Sales Managers
Sales managers can use Salesforce dashboards to gain insight into their team’s performance and make data-driven decisions. With access to real-time data, sales managers can quickly identify issues and take action to address them.
For example, a sales manager can use a dashboard to track the progress of individual sales reps and identify areas where additional coaching or training may be needed. They can also use dashboards to monitor the progress of sales campaigns and adjust their strategies as needed.
For Sales Representatives
Sales representatives can also benefit from using Salesforce dashboards. With access to real-time data, reps can quickly identify opportunities and take action to close deals.
For example, a rep can use a dashboard to track their progress towards meeting their sales targets and adjust their approach to ensure they hit their goals.
They can also use dashboards to track the progress of individual deals and identify areas where additional effort may be needed.
Analyzing Opportunities with Salesforce Dashboards
Salesforce dashboards can be used to analyze opportunities and identify areas where additional effort may be needed. For example, a dashboard can be used to track the progress of leads through the sales pipeline and identify areas where leads are dropping off.
This information can be used to adjust sales strategies and ensure that opportunities are not being missed.
Monitoring Sales Performance with Salesforce Dashboards
Salesforce dashboards can also be used to monitor sales performance and identify areas for improvement.
For example, a dashboard can be used to track the progress of individual sales reps and identify areas where additional coaching or training may be needed.
They can also be used to track the progress of sales campaigns and adjust strategies as needed.
Salesforce Dashboard Frequently Asked Questions
What are the benefits of using Salesforce dashboards?
Salesforce dashboards provide a quick and easy way to visualize data and gain insights into your organization’s performance. Dashboards allow you to monitor key metrics, track progress toward goals, and identify areas for improvement. With Salesforce dashboards, you can make informed decisions based on real-time data and stay ahead of the competition.
How do I create a dynamic dashboard in Salesforce?
To create a dynamic dashboard in Salesforce, you can use dynamic dashboards. Dynamic dashboards allow you to create a single dashboard that can be customized to display different data based on the user viewing it. To create a dynamic dashboard, you will need to create a dashboard with a source report that contains a filter. Then, you can add a dashboard component that uses the filter to display data based on the user’s selection.
What are some best practices for creating Salesforce dashboards?
Here are some best practices to keep in mind when creating Salesforce dashboards:
- Keep it simple and focused: Focus on the most important metrics and keep the dashboard simple and easy to read.
- Use charts and graphs: Charts and graphs are a great way to visualize data and make it easier to understand.
- Avoid clutter: Don’t overload the dashboard with too much information. Keep it clean and easy to read.
- Use color coding: Use color coding to highlight important data and make it stand out.
- Test and iterate: Test your dashboard with different users and iterate based on their feedback.
Can I customize Salesforce dashboard components?
Yes, you can customize Salesforce dashboard components. You can change the size, position, and type of component, as well as the data it displays. You can also add filters and change the way data is displayed within the component.
How do I create a dashboard in Salesforce Lightning?
To create a dashboard in Salesforce Lightning, follow these steps:
- Click on the App Launcher and select “Sales” or “Service” from the dropdown menu.
- Click on the “Dashboards” tab.
- Click on the “New Dashboard” button.
- Select the type of dashboard you want to create (standard or custom).
- Choose the components you want to add to your dashboard.
- Customize the components as needed.
- Save your dashboard.